Arrival needed confirmation.
GPS guidance did not necessarily tell someone that they were at the correct bus stop or entrance. Travelers also used physical landmarks and tactile information to establish where they were.
UNIVERSITY OF WASHINGTON / HCDE CAPSTONE / 2020
Helping blind and low-vision travelers understand what is around them—not only where to go next.
The original plan uses the name Sensed; this portfolio previously catalogued the project as Censed. This account reconstructs the formative research and intended approach from that plan. The final presentation will add what changed and what the team ultimately delivered.
READ THE ORIGINAL PLAN · 23 PAGES ↗Reaching a destination meant continually interpreting an environment: confirming a bus stop, noticing an approaching bicycle, finding a building entrance, or responding to construction on a familiar route. A cane, a guide dog, a phone, and remembered landmarks each provided different pieces of that picture.
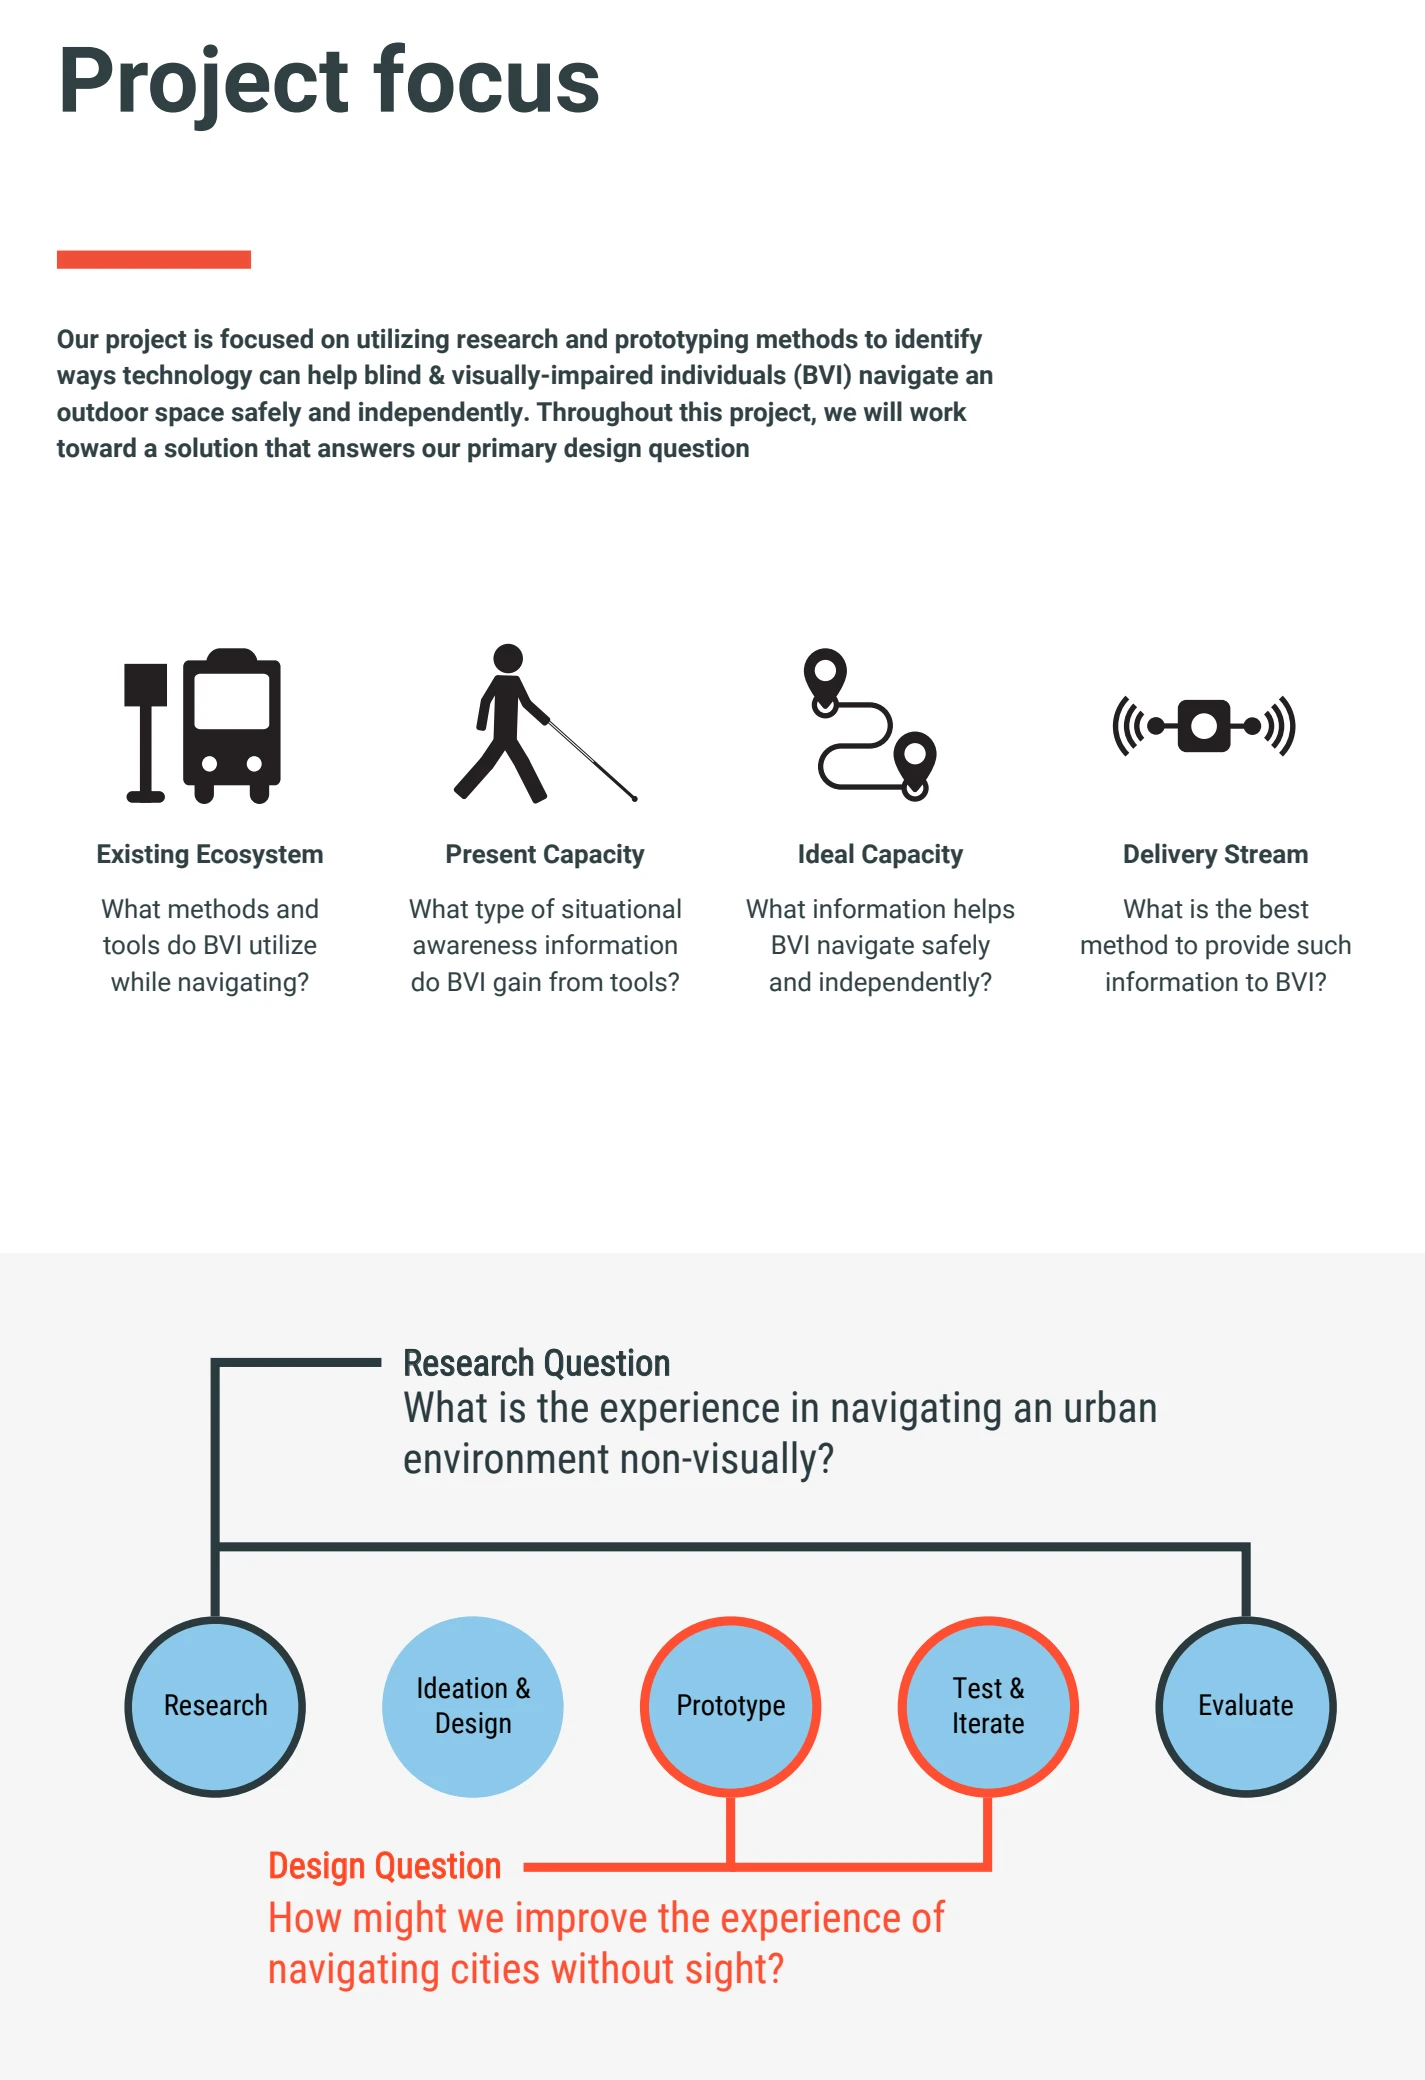
Our early work focused on outdoor urban navigation, primarily in Seattle. The plan prioritized working adults who traveled through the city and older adults adapting to sight loss. We wanted to understand how people combined tools and learned techniques—and where information was still missing.
How might we improve the experience of navigating cities without sight?
The team’s design question, recorded on page 8.
The intended direction was to complement existing navigation tools. The question was what additional information would help a traveler act safely and independently, and how to communicate it without competing with the senses they already relied on.
02 / FORMATIVE RESEARCH
The plan documents early interviews, secondary research, and a review of assistive products. It does not report a completed-study sample size; the findings below describe the team’s formative synthesis.
CAPSTONE PLAN / PAGES 10–14 ↗GPS guidance did not necessarily tell someone that they were at the correct bus stop or entrance. Travelers also used physical landmarks and tactile information to establish where they were.
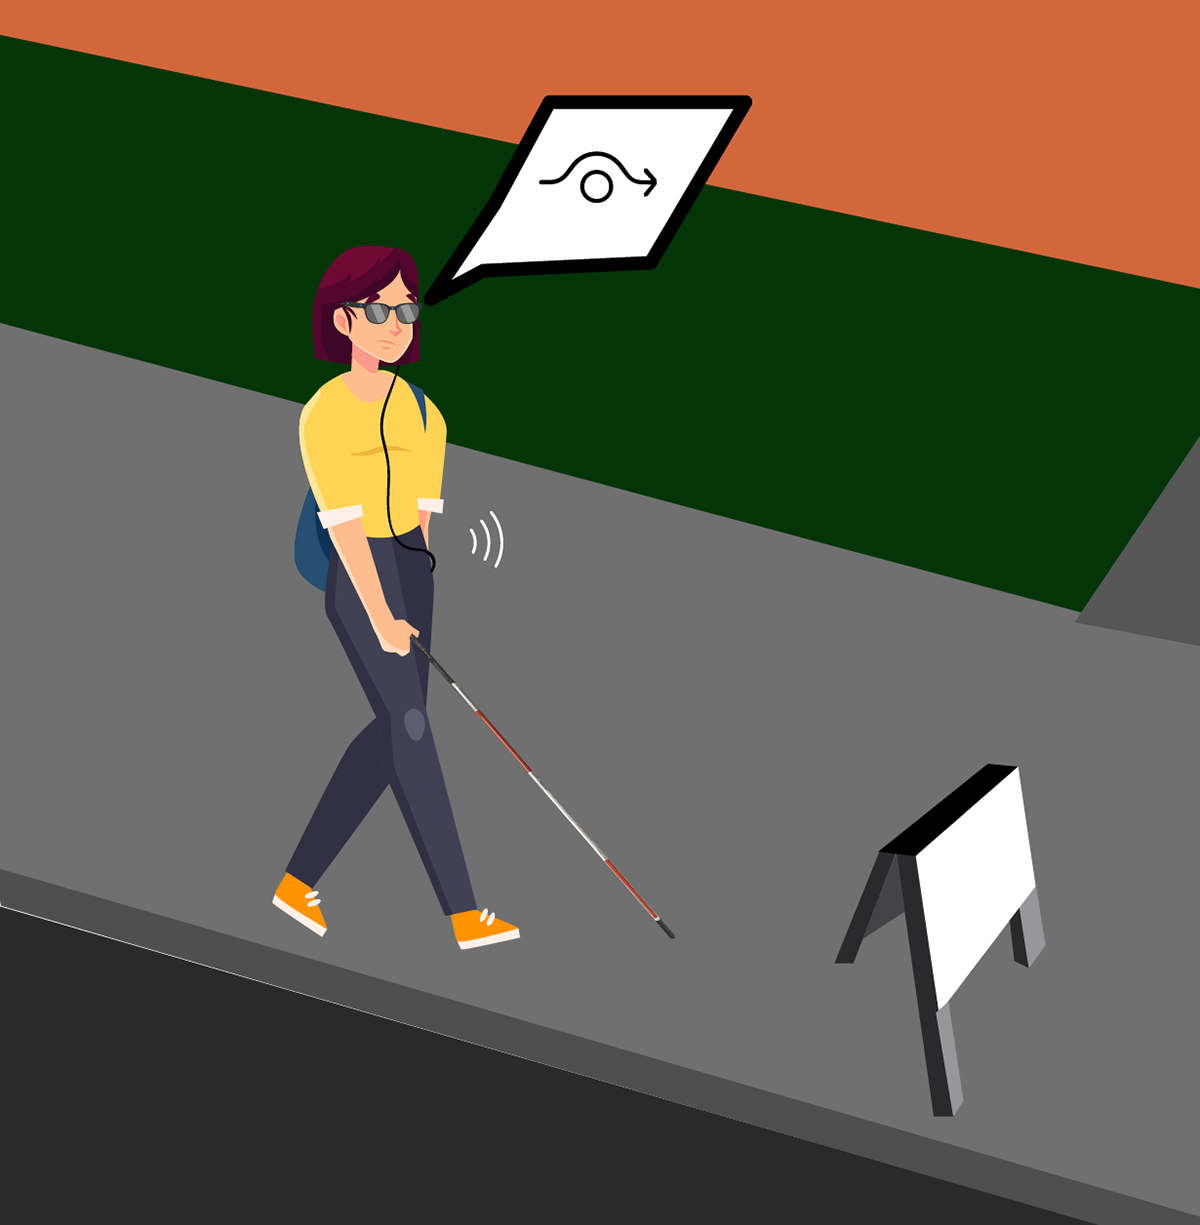
Construction, an unexpected object, or an approaching person could interrupt a route. Detecting the obstacle and recovering an understanding of the surrounding space were connected needs.
Nonvisual travel required attention to many sensory signals. Audio or haptic feedback would have to fit that existing cognitive load and the traveler’s practiced use of assistive tools.
A tactile sign could be useful only if a traveler could locate it. The same challenge extended to recognizing landmarks, identifying a destination, and knowing when to request help.
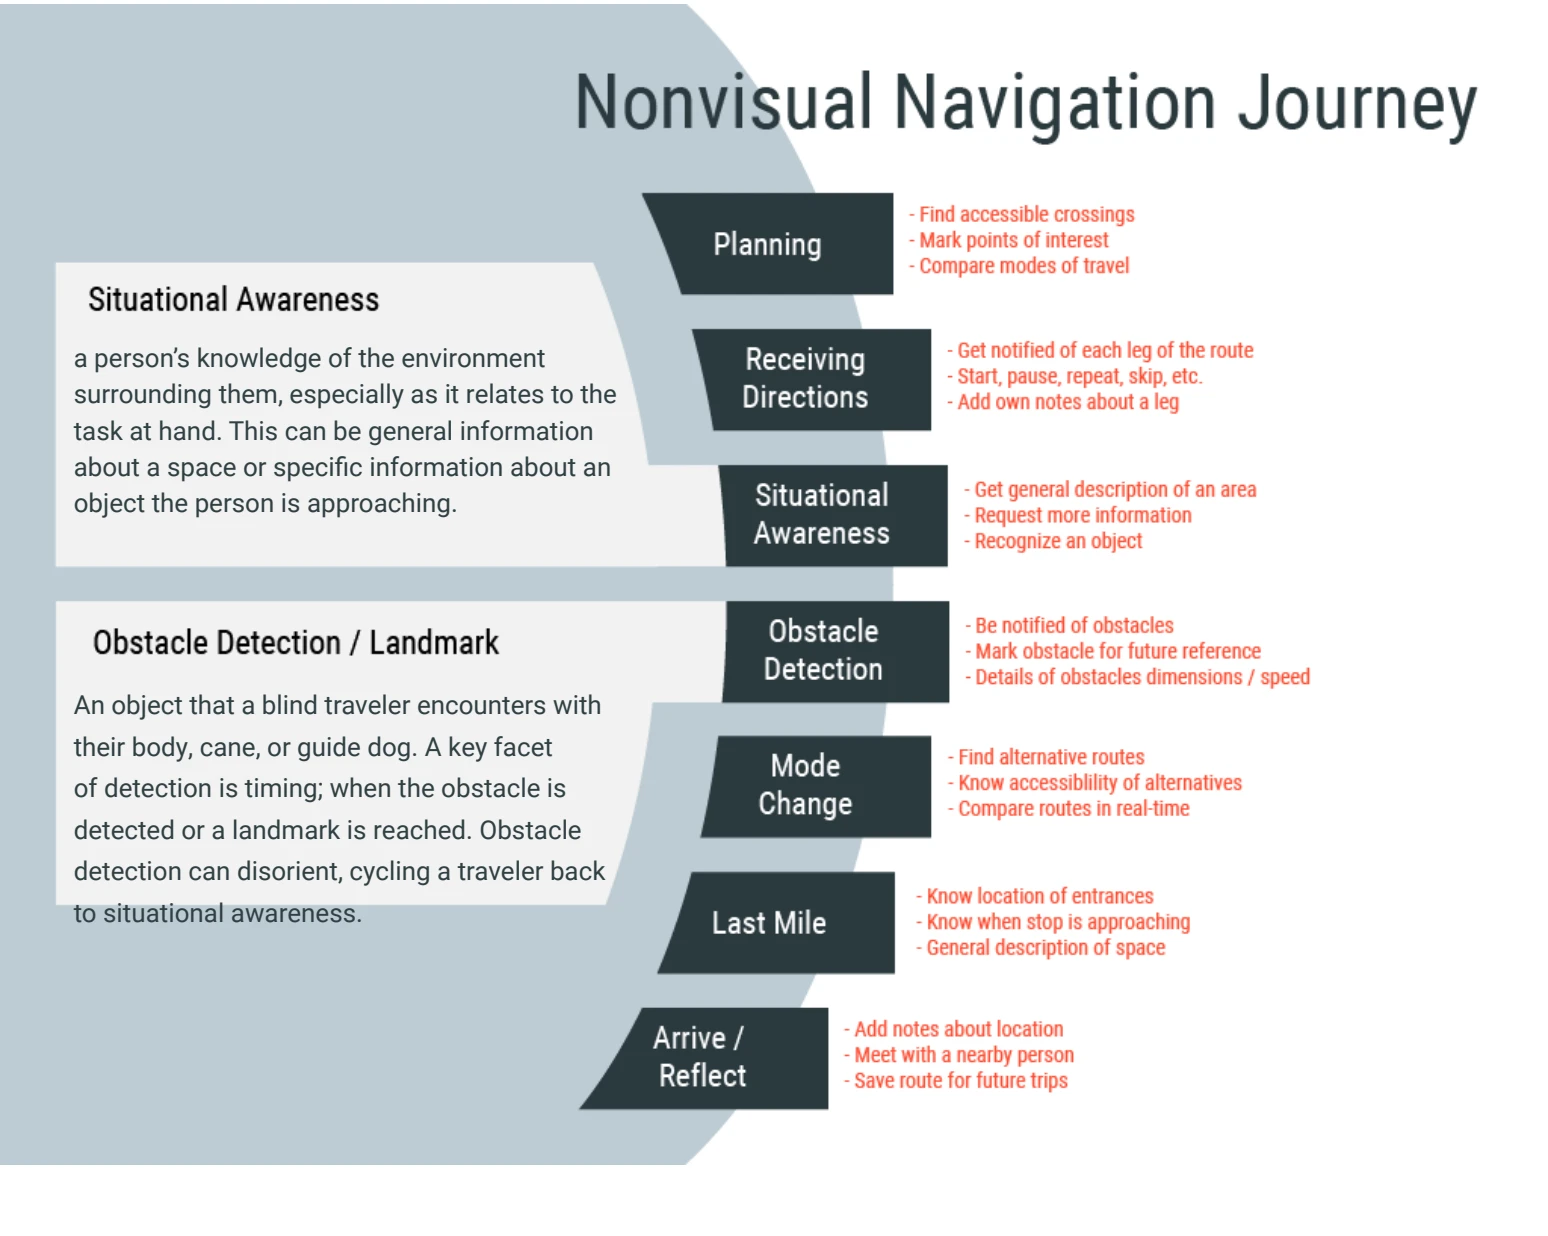
The journey map gave the team a common structure for discussing nonvisual travel. It also revealed why navigation was not a simple sequence: encountering an obstacle could send someone back into the work of establishing situational awareness.
Find accessible crossings, mark places, and compare ways to travel.
Follow route segments and control the pace of guidance.
Understand the surrounding space and ask for more detail.
Notice an obstacle, its dimensions, and whether it is moving.
Find an alternative route and assess its accessibility.
Locate an entrance or recognize that the destination is near.
Record useful details and save the route for another trip.
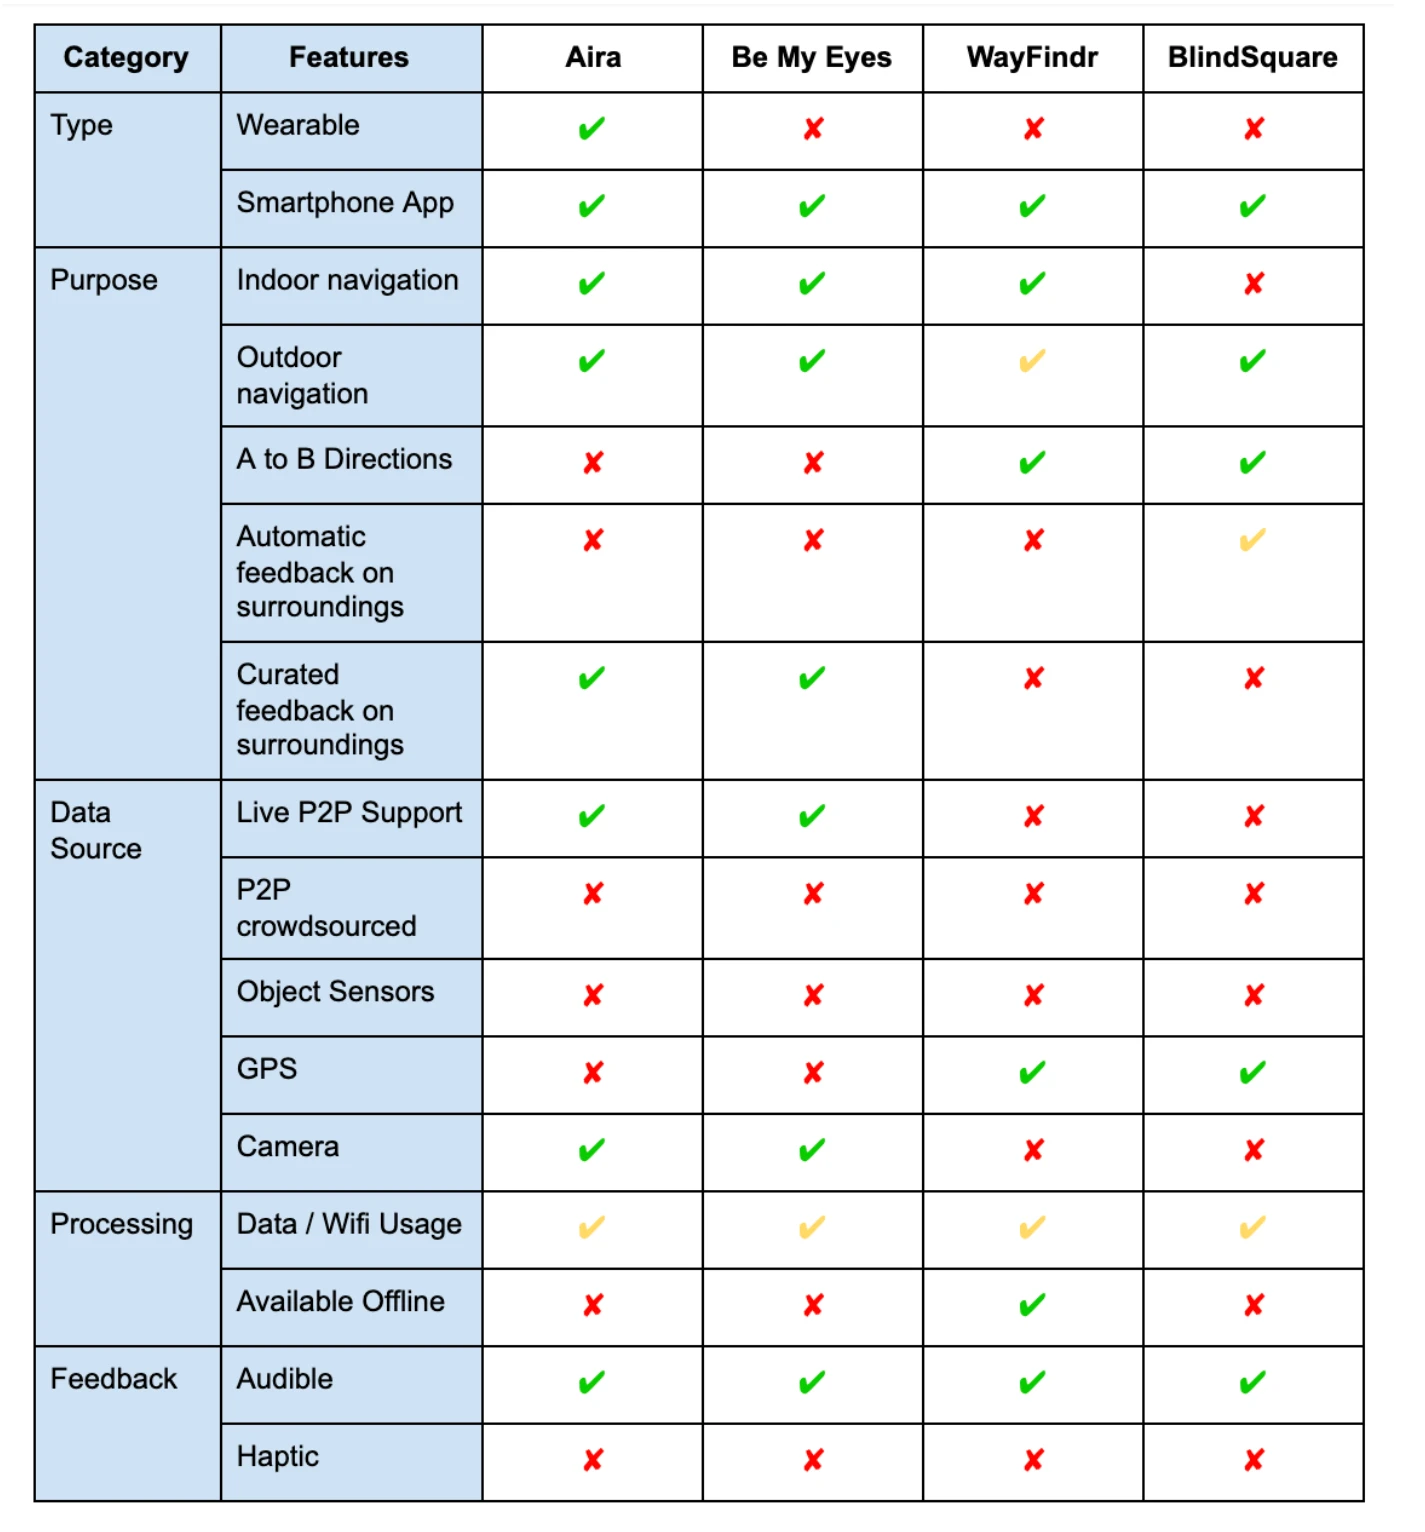
The team compared Aira, Be My Eyes, WayFindr, and BlindSquare across navigation tasks, data sources, connectivity, and feedback. This was a March 2020 landscape assessment, rather than a current product comparison.
That review helped focus the project on situational awareness and obstacle detection. The aim was to enhance the surrounding tool ecosystem while investigating other ways to deliver useful environmental information.
None of the team members were blind or visually impaired. The plan therefore positioned participatory design as a way to involve people with lived expertise throughout research, ideation, prototyping, and evaluation.
The methods were intended to build on one another: interviews with travelers and subject-matter experts would inform experience-based surveys; shadowing would reveal behavior in context; co-design sessions would turn participant priorities into requirements and prototypes.
Use interviews to frame the problem and develop survey questions grounded in participants’ experiences. Prioritize screen-reader accessibility for the survey.
Shadow a familiar commute, ask questions when appropriate, and debrief afterward. At least one shadowing session was an ambition in the plan, not a reported result.
Conventional sticky-note activities assumed visual access. The team proposed testing collaboration tools with screen readers and creating spaces where participants could contribute and revise ideas.
The plan included researcher-run simulations to identify obvious session and prototype problems. These were preparation activities; they did not establish the experience or preferences of blind participants.
The team planned three participants and four researchers per session, with time between sessions to revise the prototypes. These were recruitment and scheduling targets, not verified attendance.
Invite feedback on audio notifiers, vibration motors, pressure indicators, and other potential haptic or audio outputs.
Bring medium-fidelity prototypes into navigation scenarios. Encourage participants to add or remove features; compare alternatives where feasible.
Use a more developed prototype to examine its value and the changes a traveler would need to adopt it. Capture remaining limitations and future work.
At the start of each session, participants were to revisit the design question and requirements. The plan defined success through continuing alignment between participant needs and product features, rather than through a predetermined technical solution.
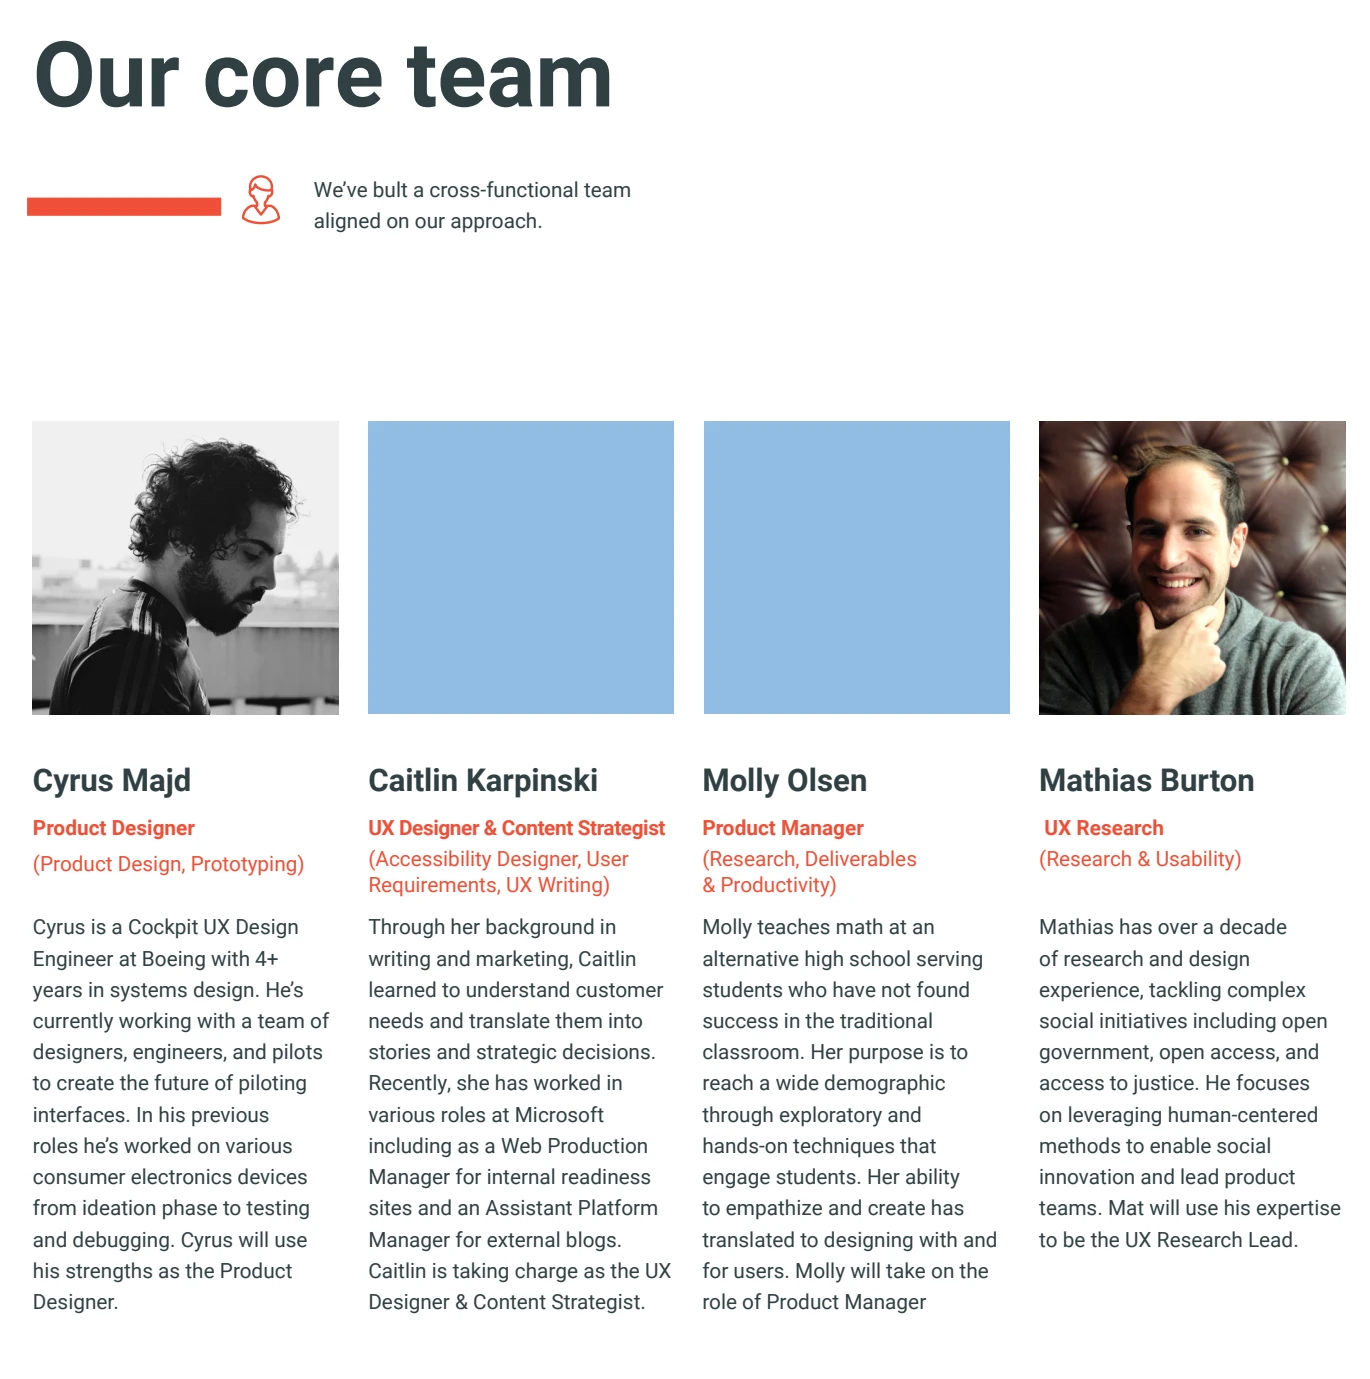
I was named UX Research Lead, with responsibility for research and usability. The plan brought that role together with product design, accessibility and content strategy, and project management. These are the roles recorded in March 2020; they are not claims of sole authorship over the team’s work.
Research and usability; human-centered methods and social innovation.
Product design and prototyping, drawing on systems and cockpit UX design.
Accessibility design, user requirements, and UX writing.
Research, deliverables, and team productivity.
The plan was issued March 20, 2020, with a planning horizon through June 12. It called for successive requirements lists, design specifications, low- through high-fidelity prototypes, and a final process book. Its schedule also named progress reports, a video, and a poster.
The existing portfolio account describes a later pandemic adaptation: a game-based remote research method that could travel to participants when in-person work became impossible. That account is retained here as later context; this planning PDF does not document the game or its results.
Archive synthesis: the recovered plan makes the project’s central tension visible—providing more situational information while protecting a traveler’s attention and agency. Evidence of how the team resolved that tension belongs in the final-stage materials.
SOURCE COLLECTION
Team, framing, formative research, journey map, methods, proposed sessions, timeline, and references.
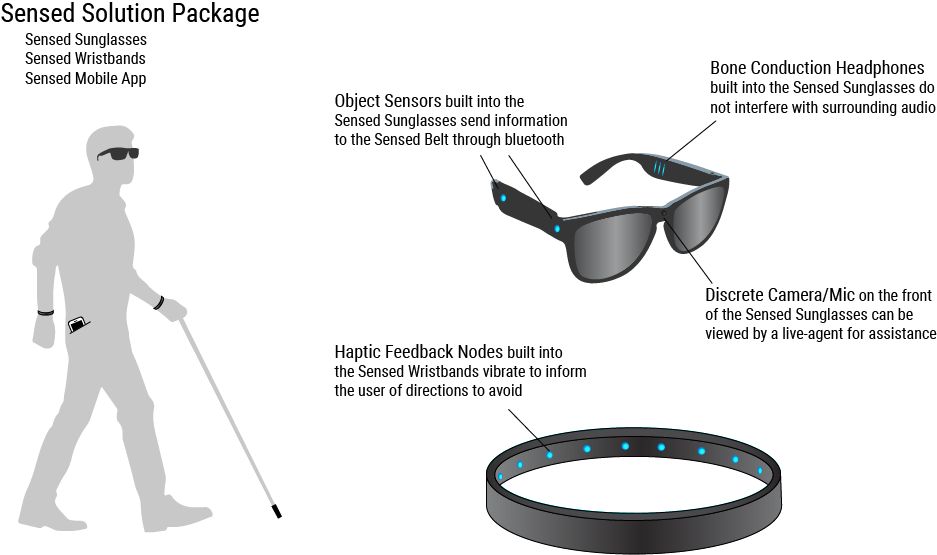
These images came from the existing portfolio, not this PDF. Their place in the project’s final sequence remains to be confirmed.