Socrata was a tech startup in Seattle, WA focused on open data in government; a civic movement that scaled up under the Obama administration, one of the company’s first customers. I, however, joined in 2017 as they were in their late stages as a product. The focus at that time was to
1) launch an enterprise platform in the next year
2) build up a UX program and
3) develop best practices for a product organization.
2) build up a UX program and
3) develop best practices for a product organization.
I led the product design team paired with directors in engineering and product management.
Planning
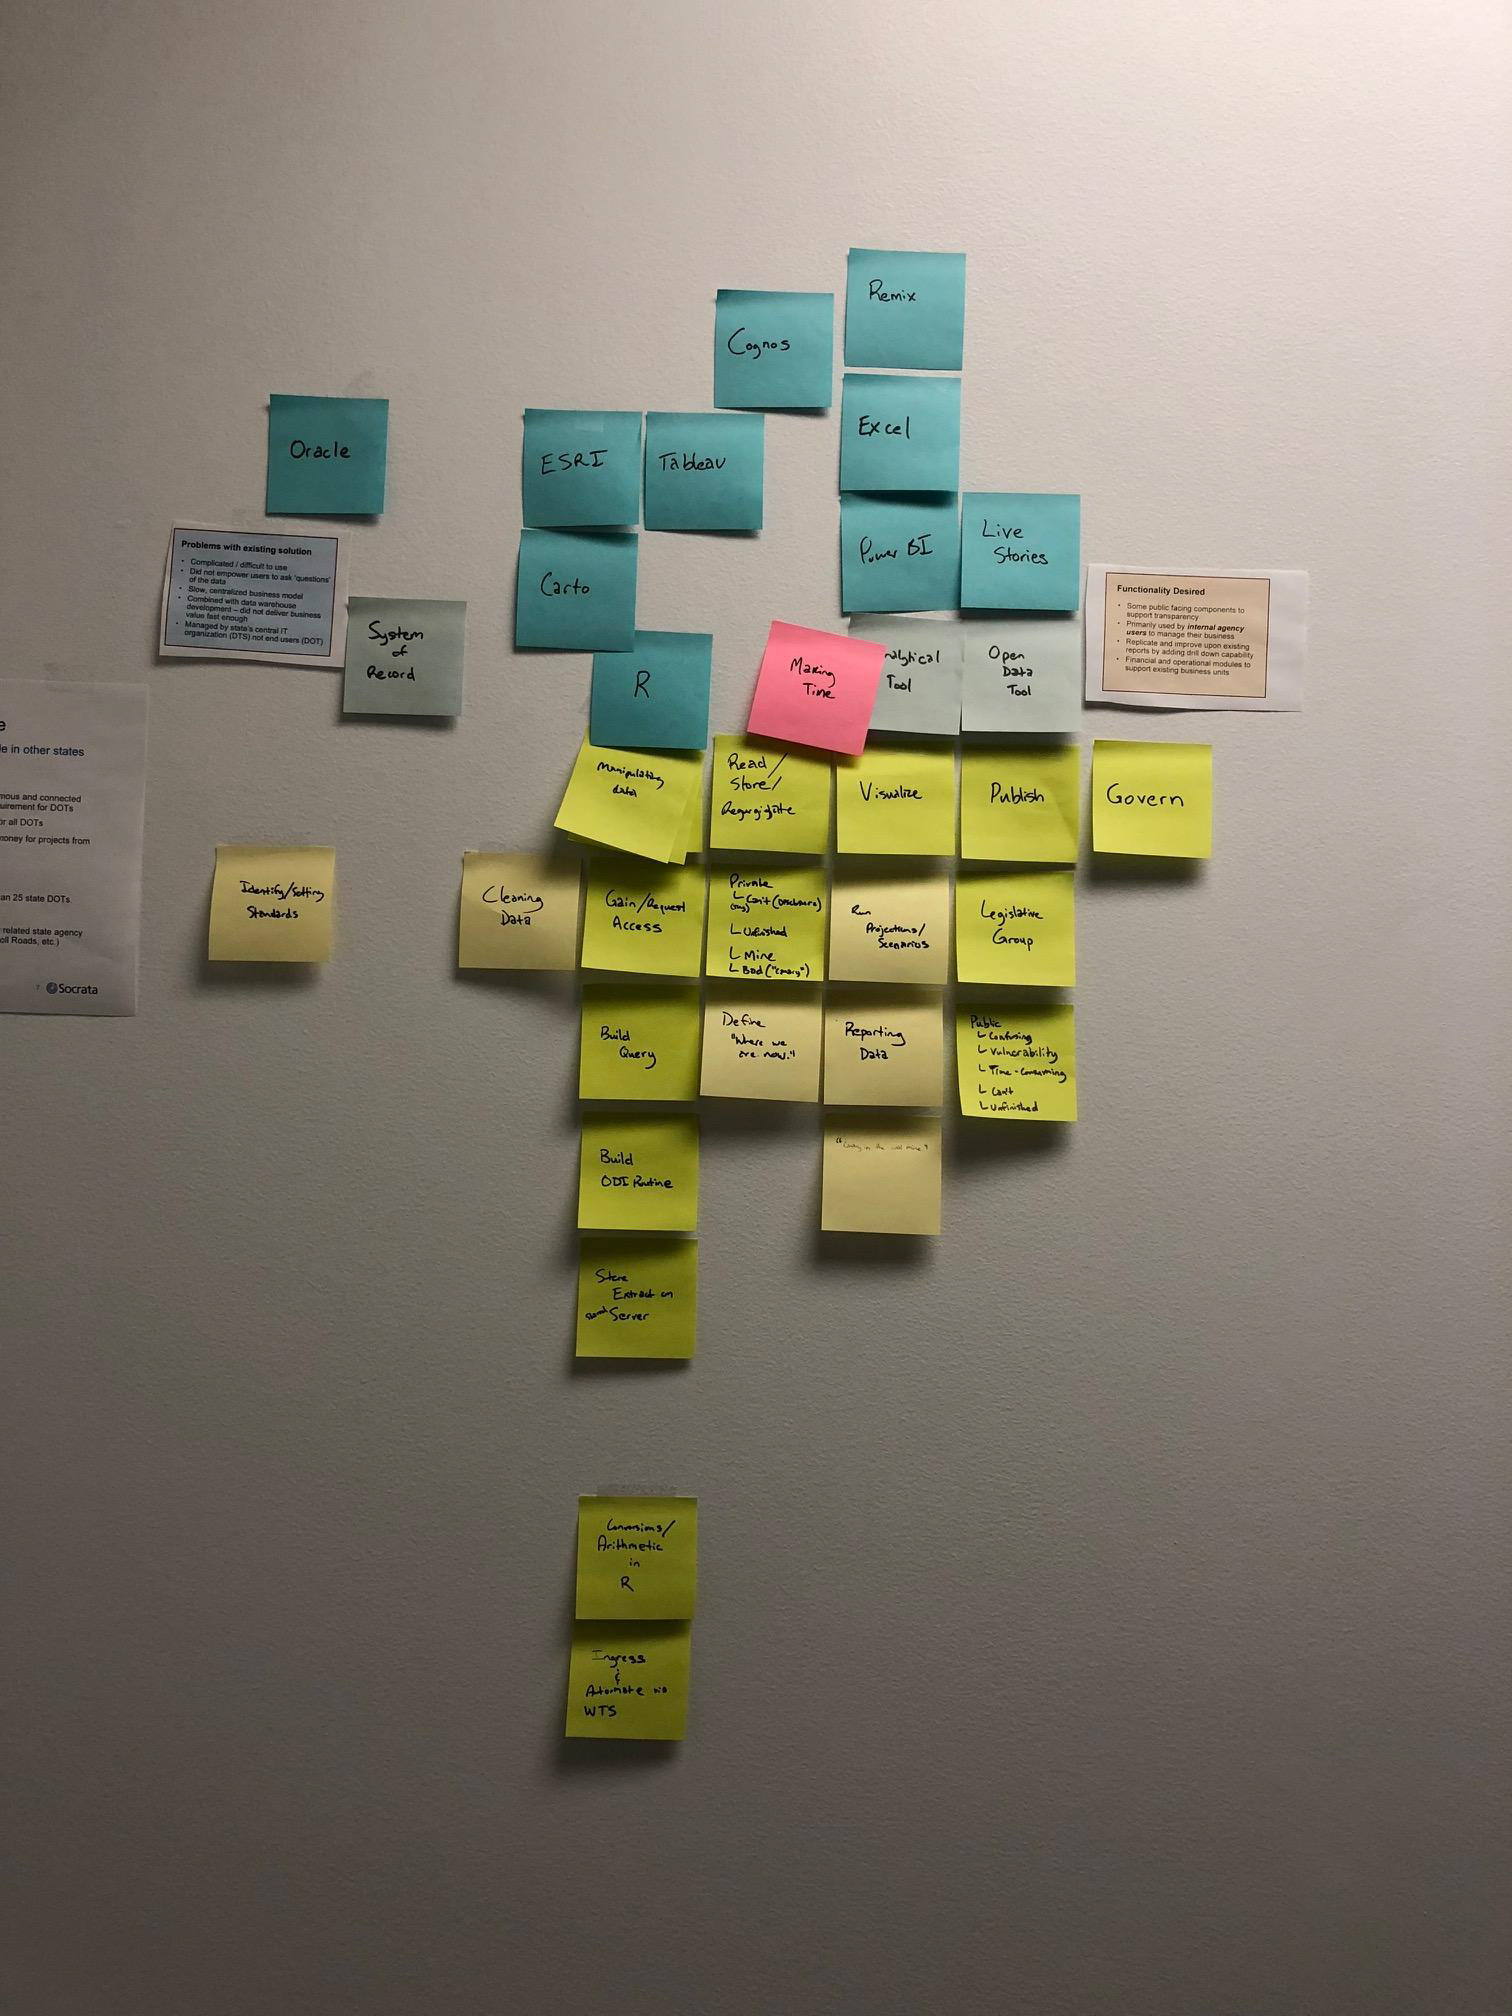
We worked as a cross functional team including engineering managers, product managers, and product designers. I worked with one of our engineering managers to introduce the process of User Story Mapping, which ultimately led to a mapping of a theoretical product that unified the different tools Socrata had created over the past 10 years
A key challenge we faced in launching our product was placement into a wide range of tools available to government IT for data work
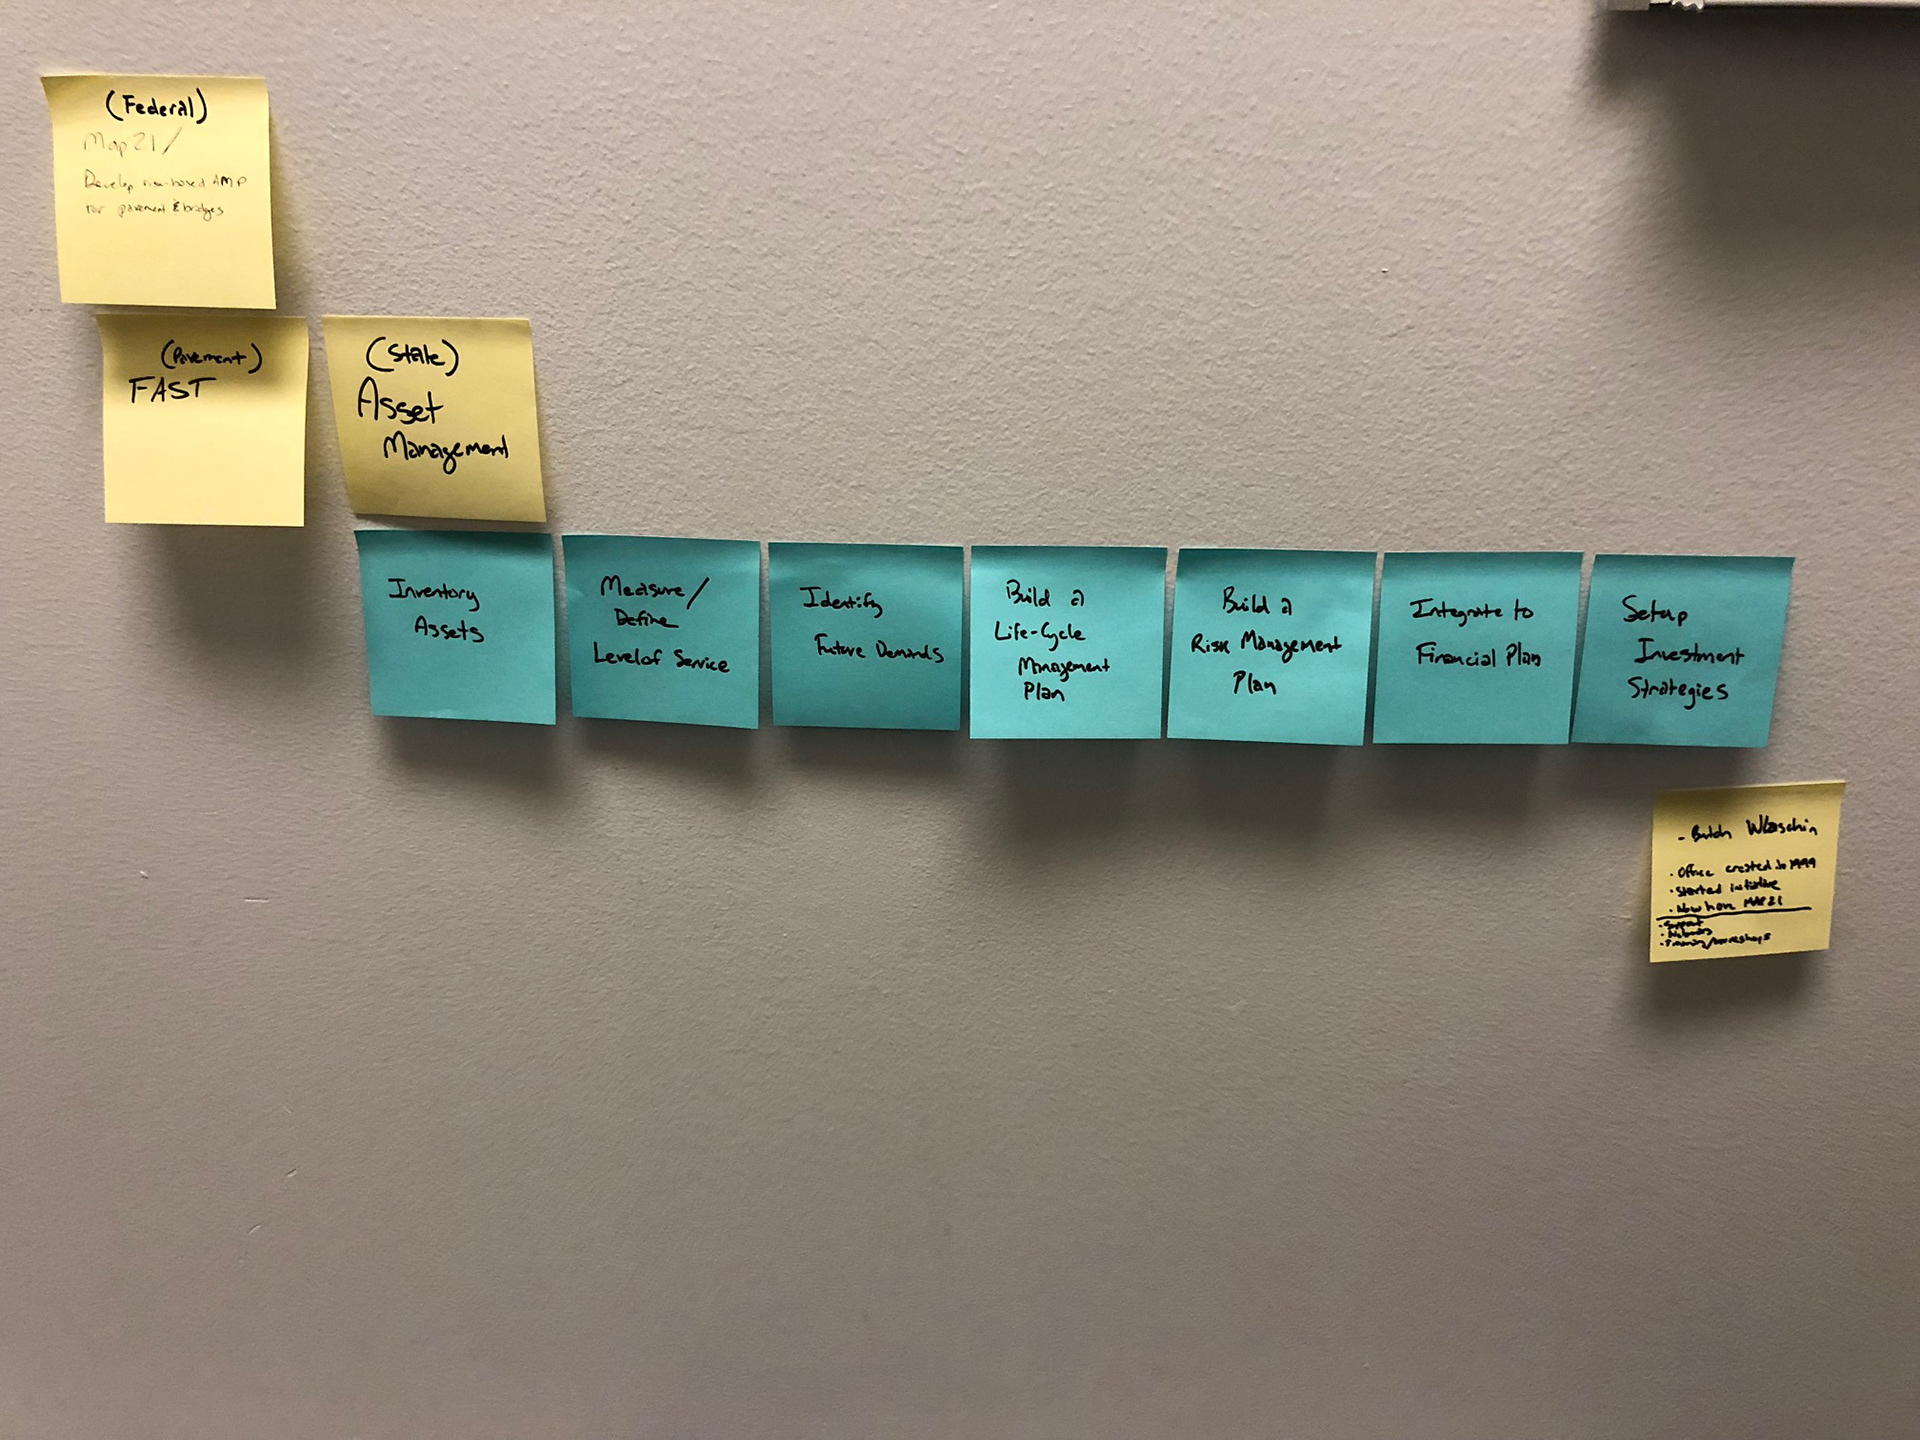
A key practice we built our MVP around were government programs that could provide a scenario with data analysis as it's key function. Here is an example based on FAST, a USDOT progrogram to support investment in transportation infrastructure.
With an existing suite of products around open data, SCGC required the mapping of a workflow "between" experiences that would follow the logical flow of a data science process. Here we modeled that experience in order to better comprehend the "story" of how a connected platform could bring together disparate data work
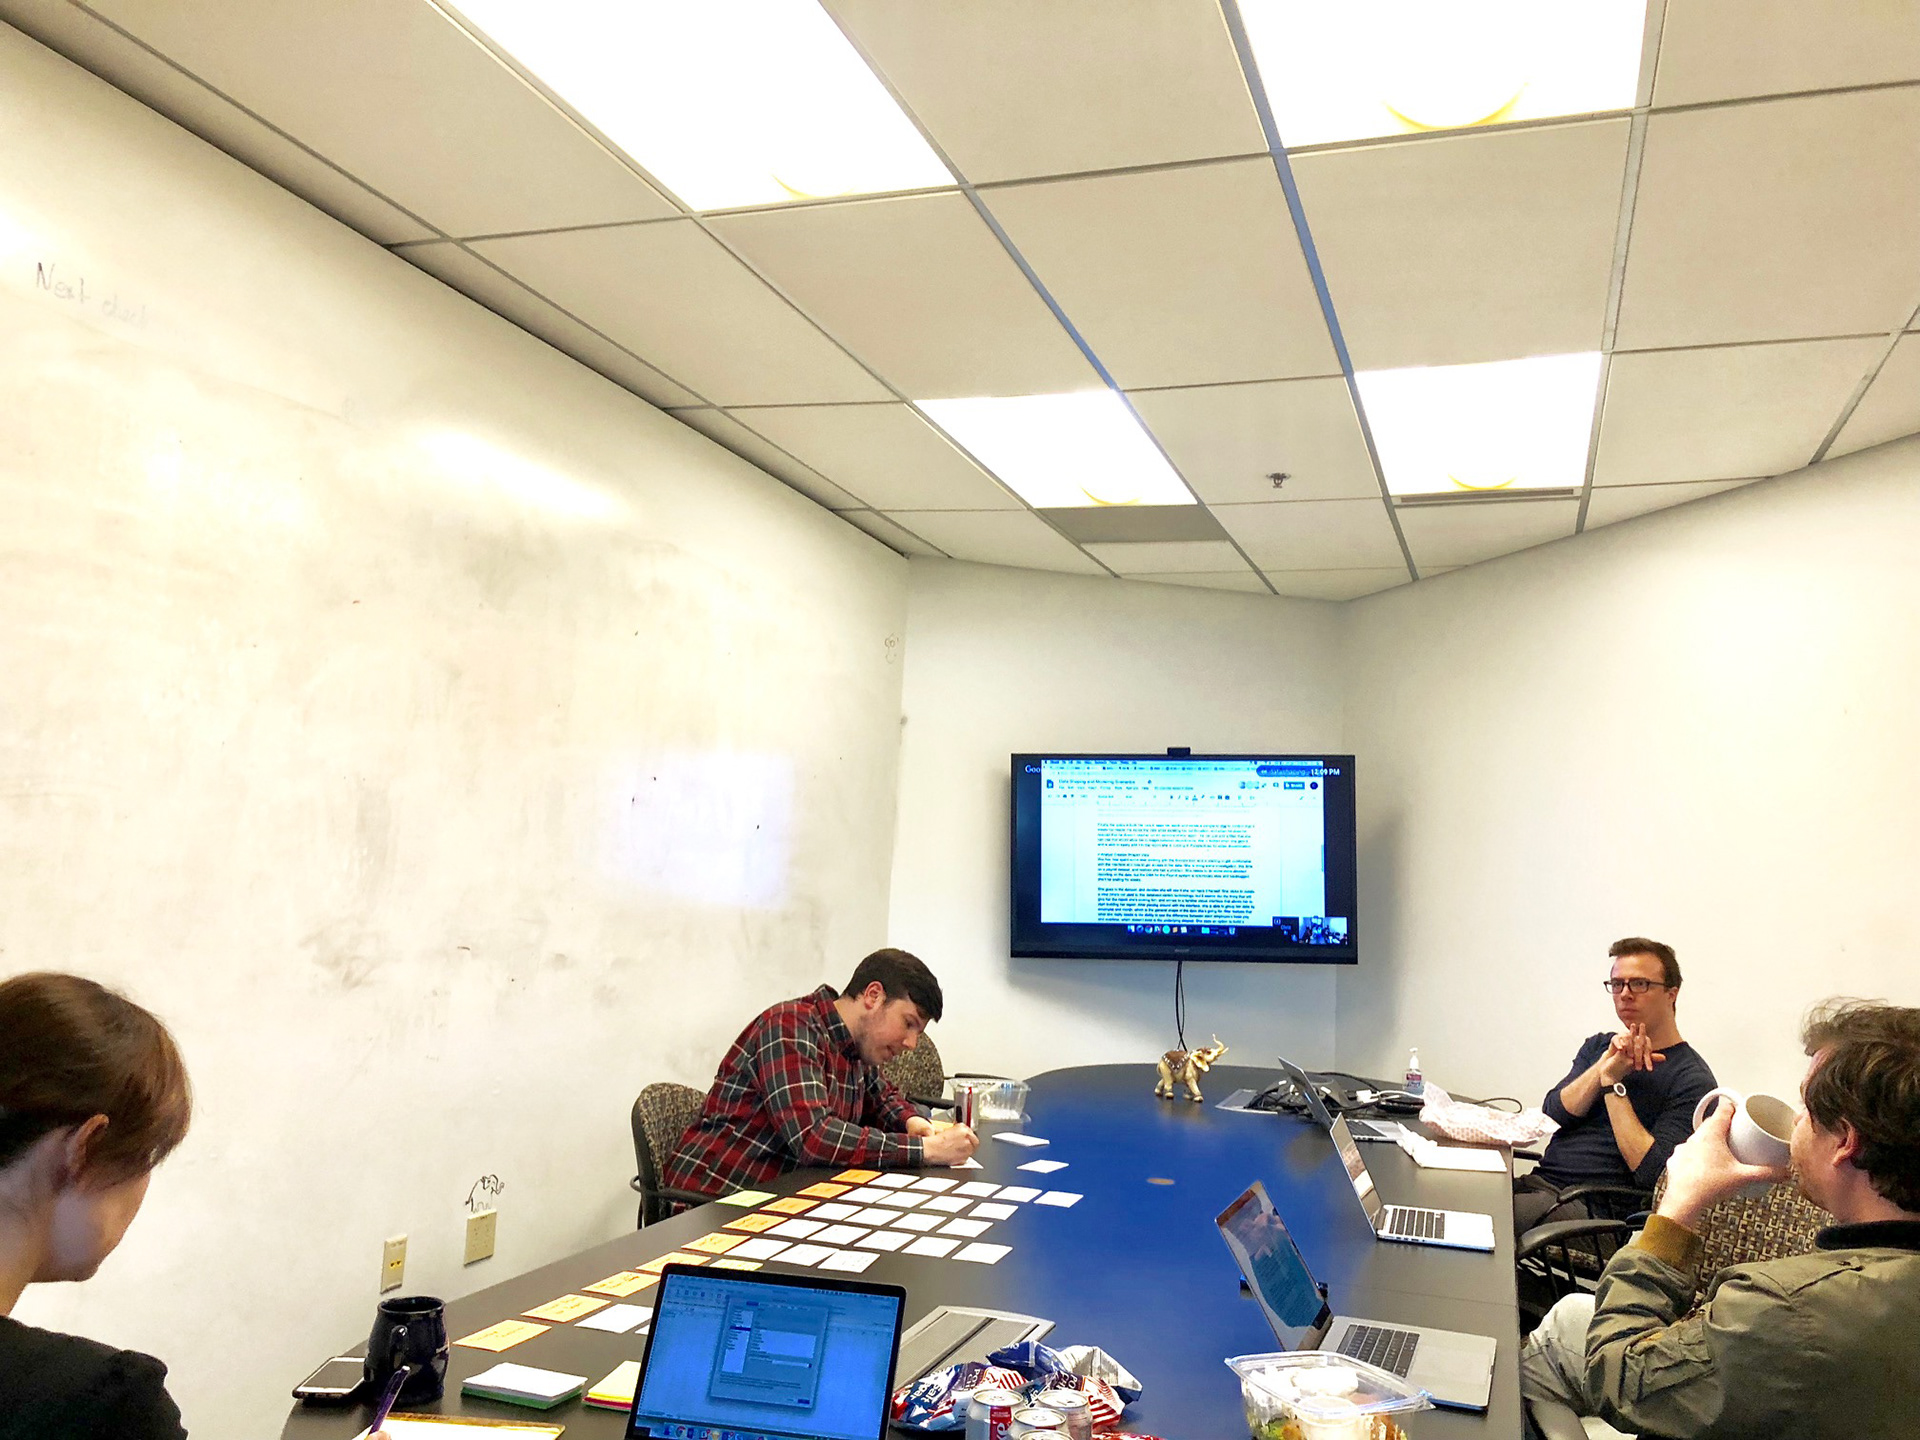
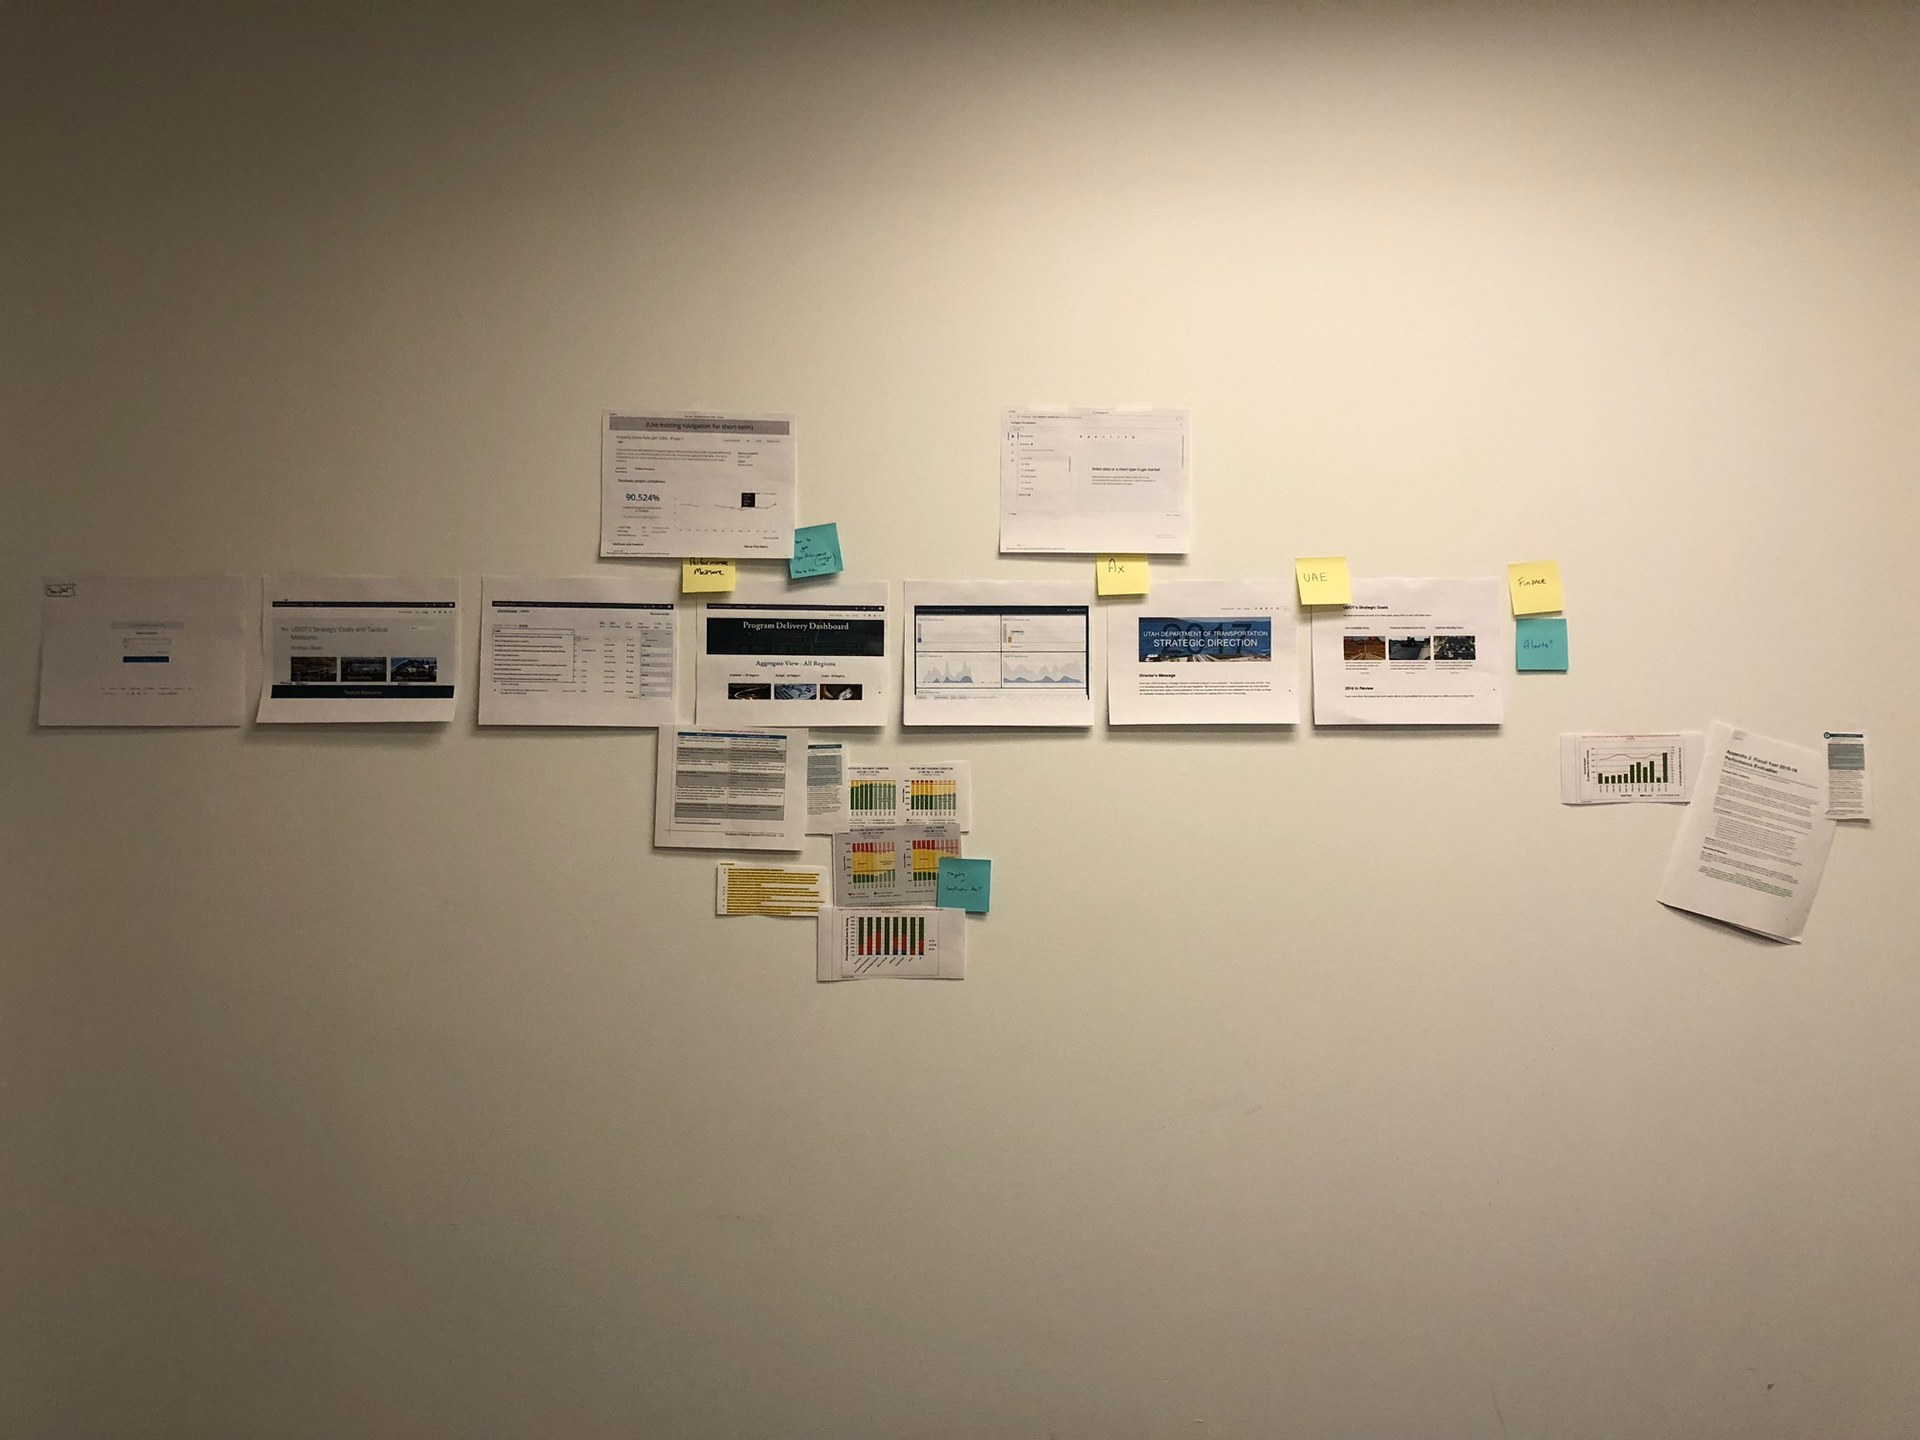
After we identified a core story to the product, we outlined a set of stories that would integrate 4 products into a single platform. I worked with the director of product and director of engineering to create a process we could follow as a prodev organization. We decided to create a physical board to keep the whole story unified. It was matched with a JIRA board to help us work down the backlog and phsycially see the progress toward an MVP
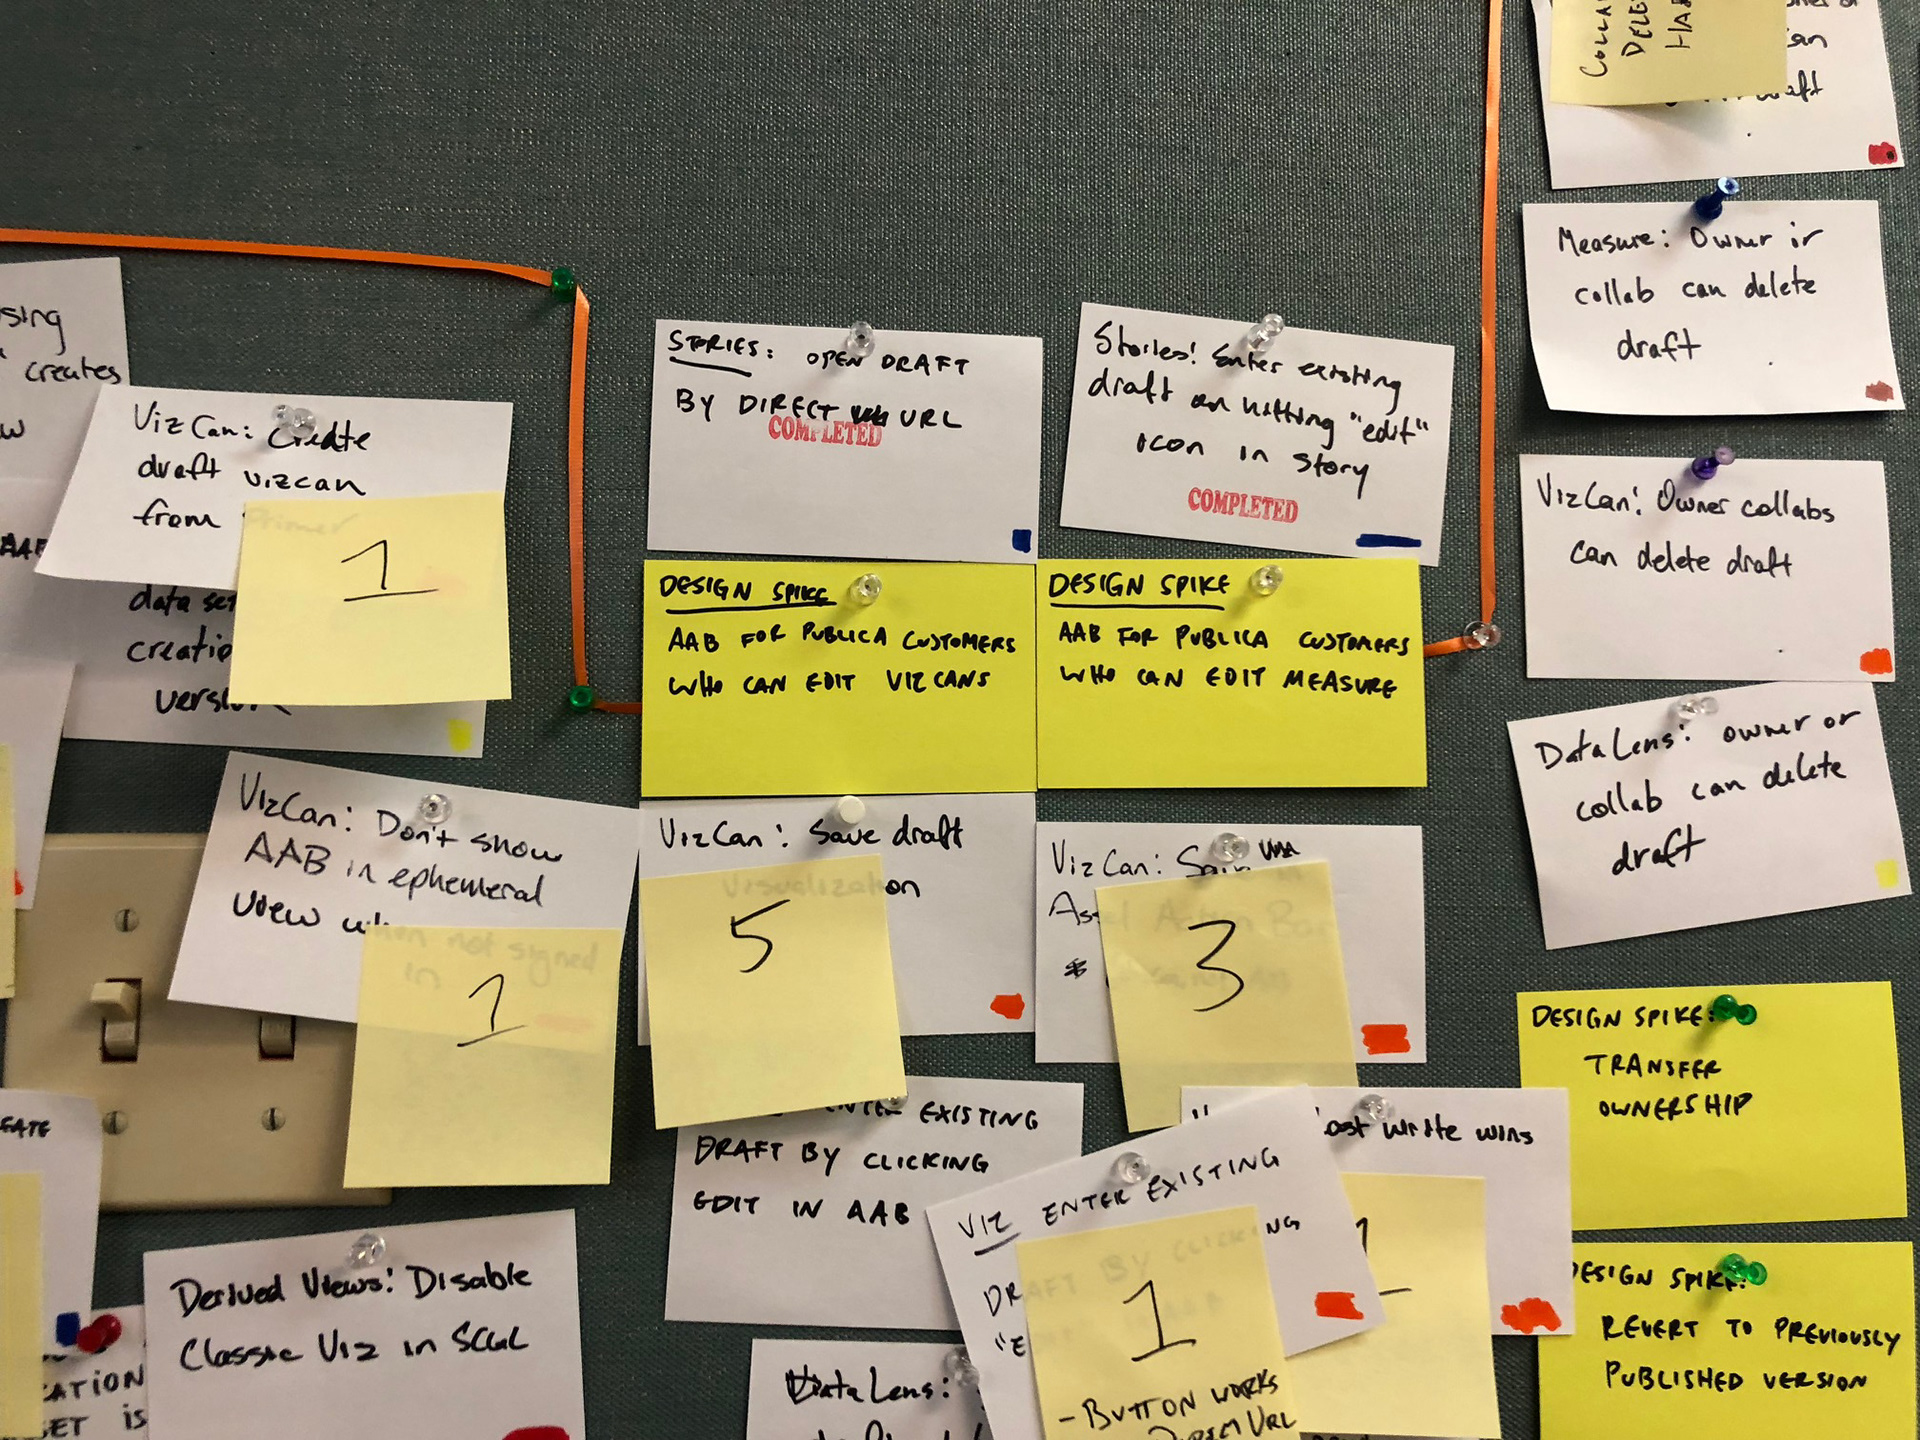
The story map and roadmap became living documents that became "layered" with plans for research, prioritization, scoping, and prototyping. I created a concept of design spikes so that our UX process could work in sync with the engineering efforts and leverage the scrum language the team was familiar with
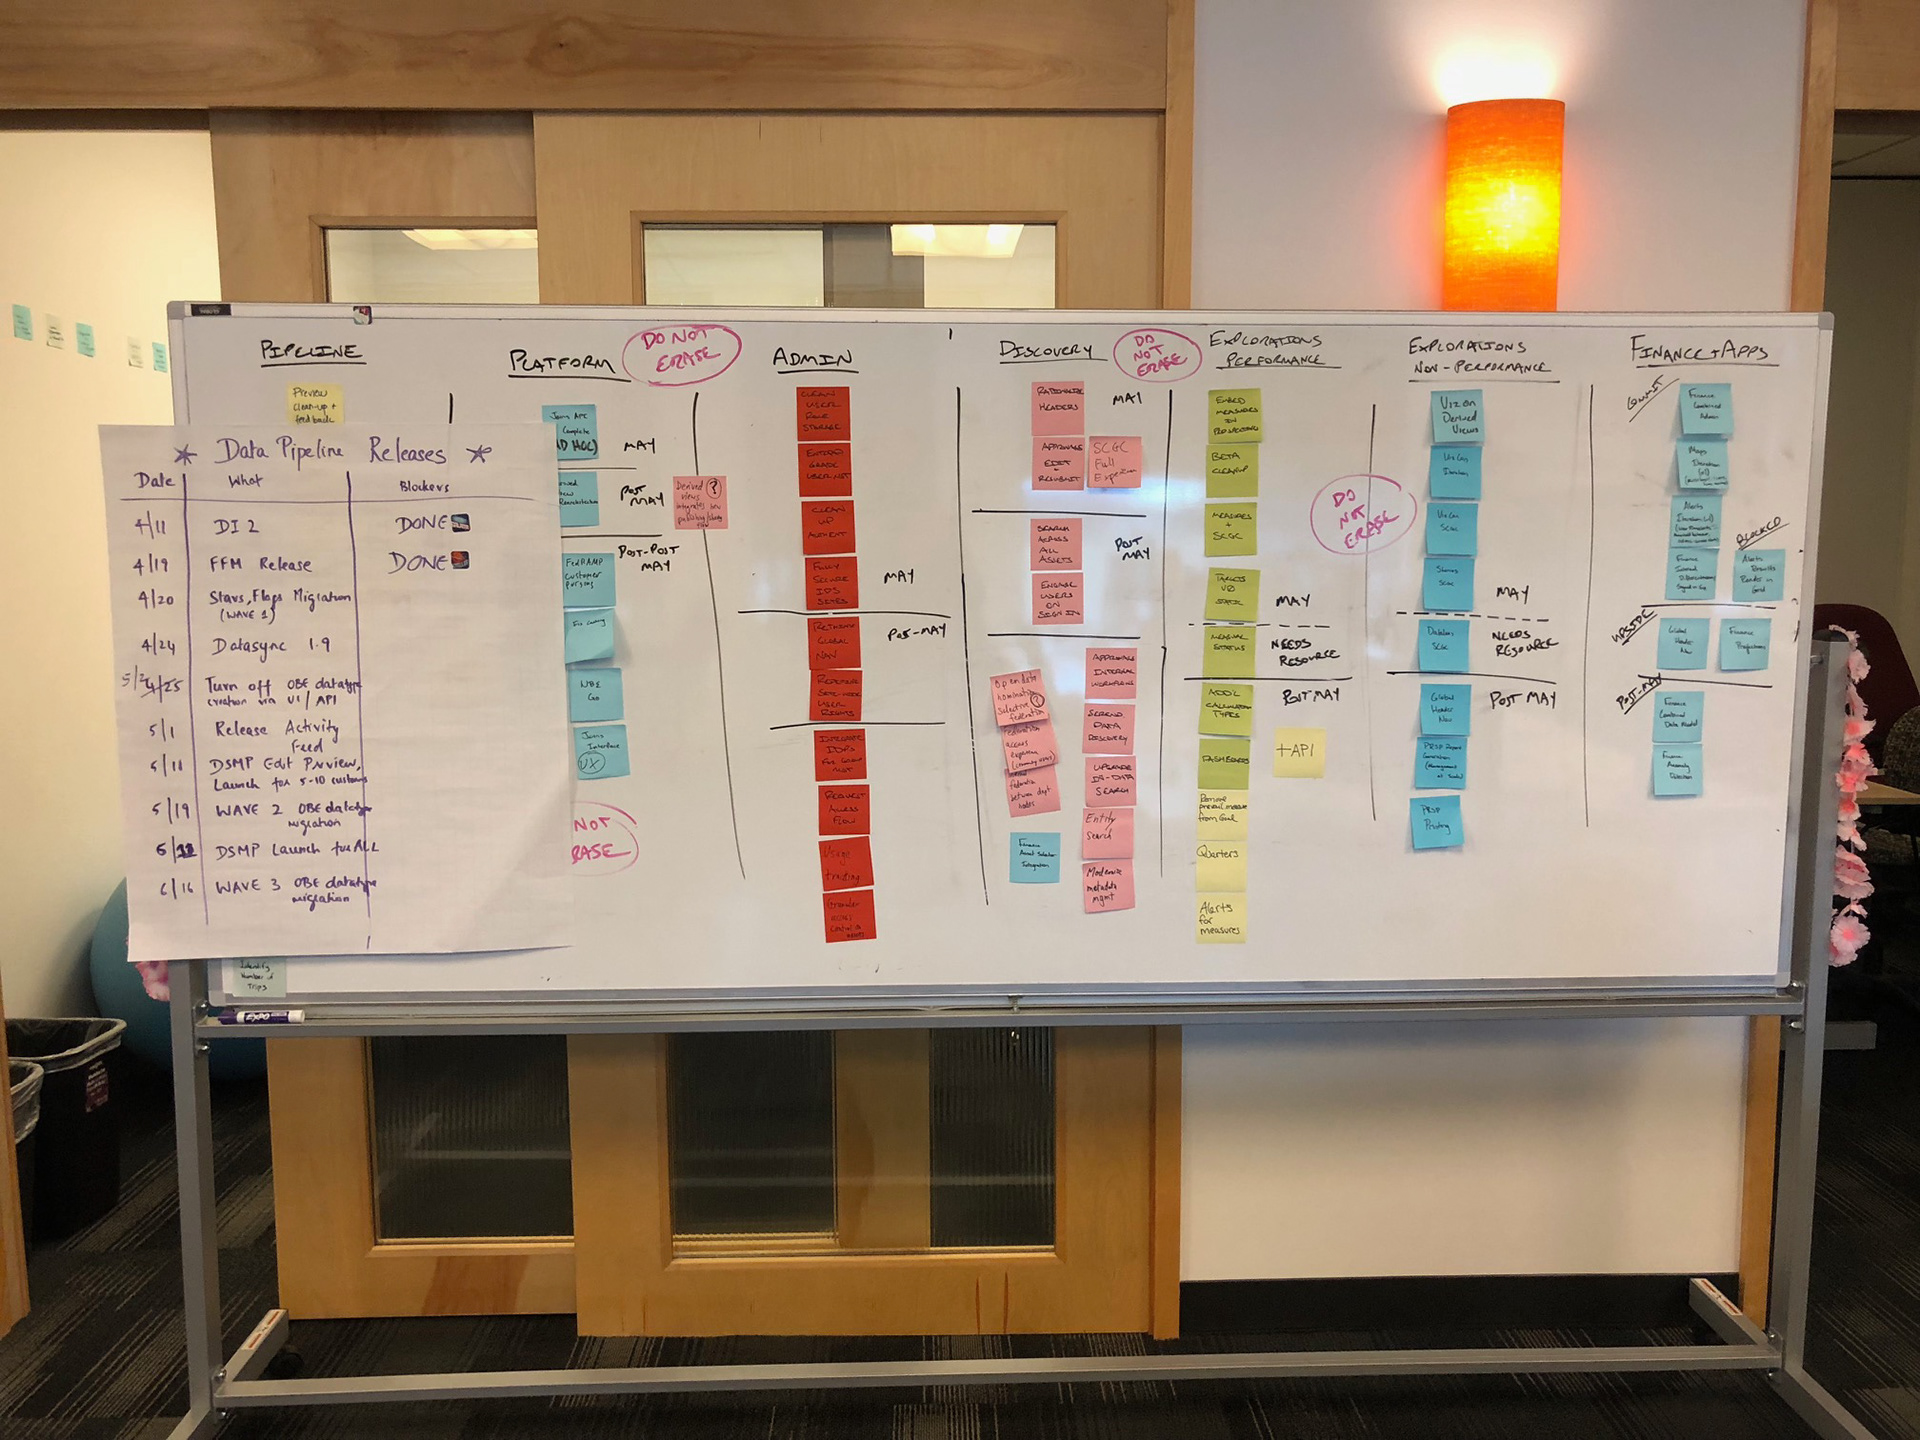
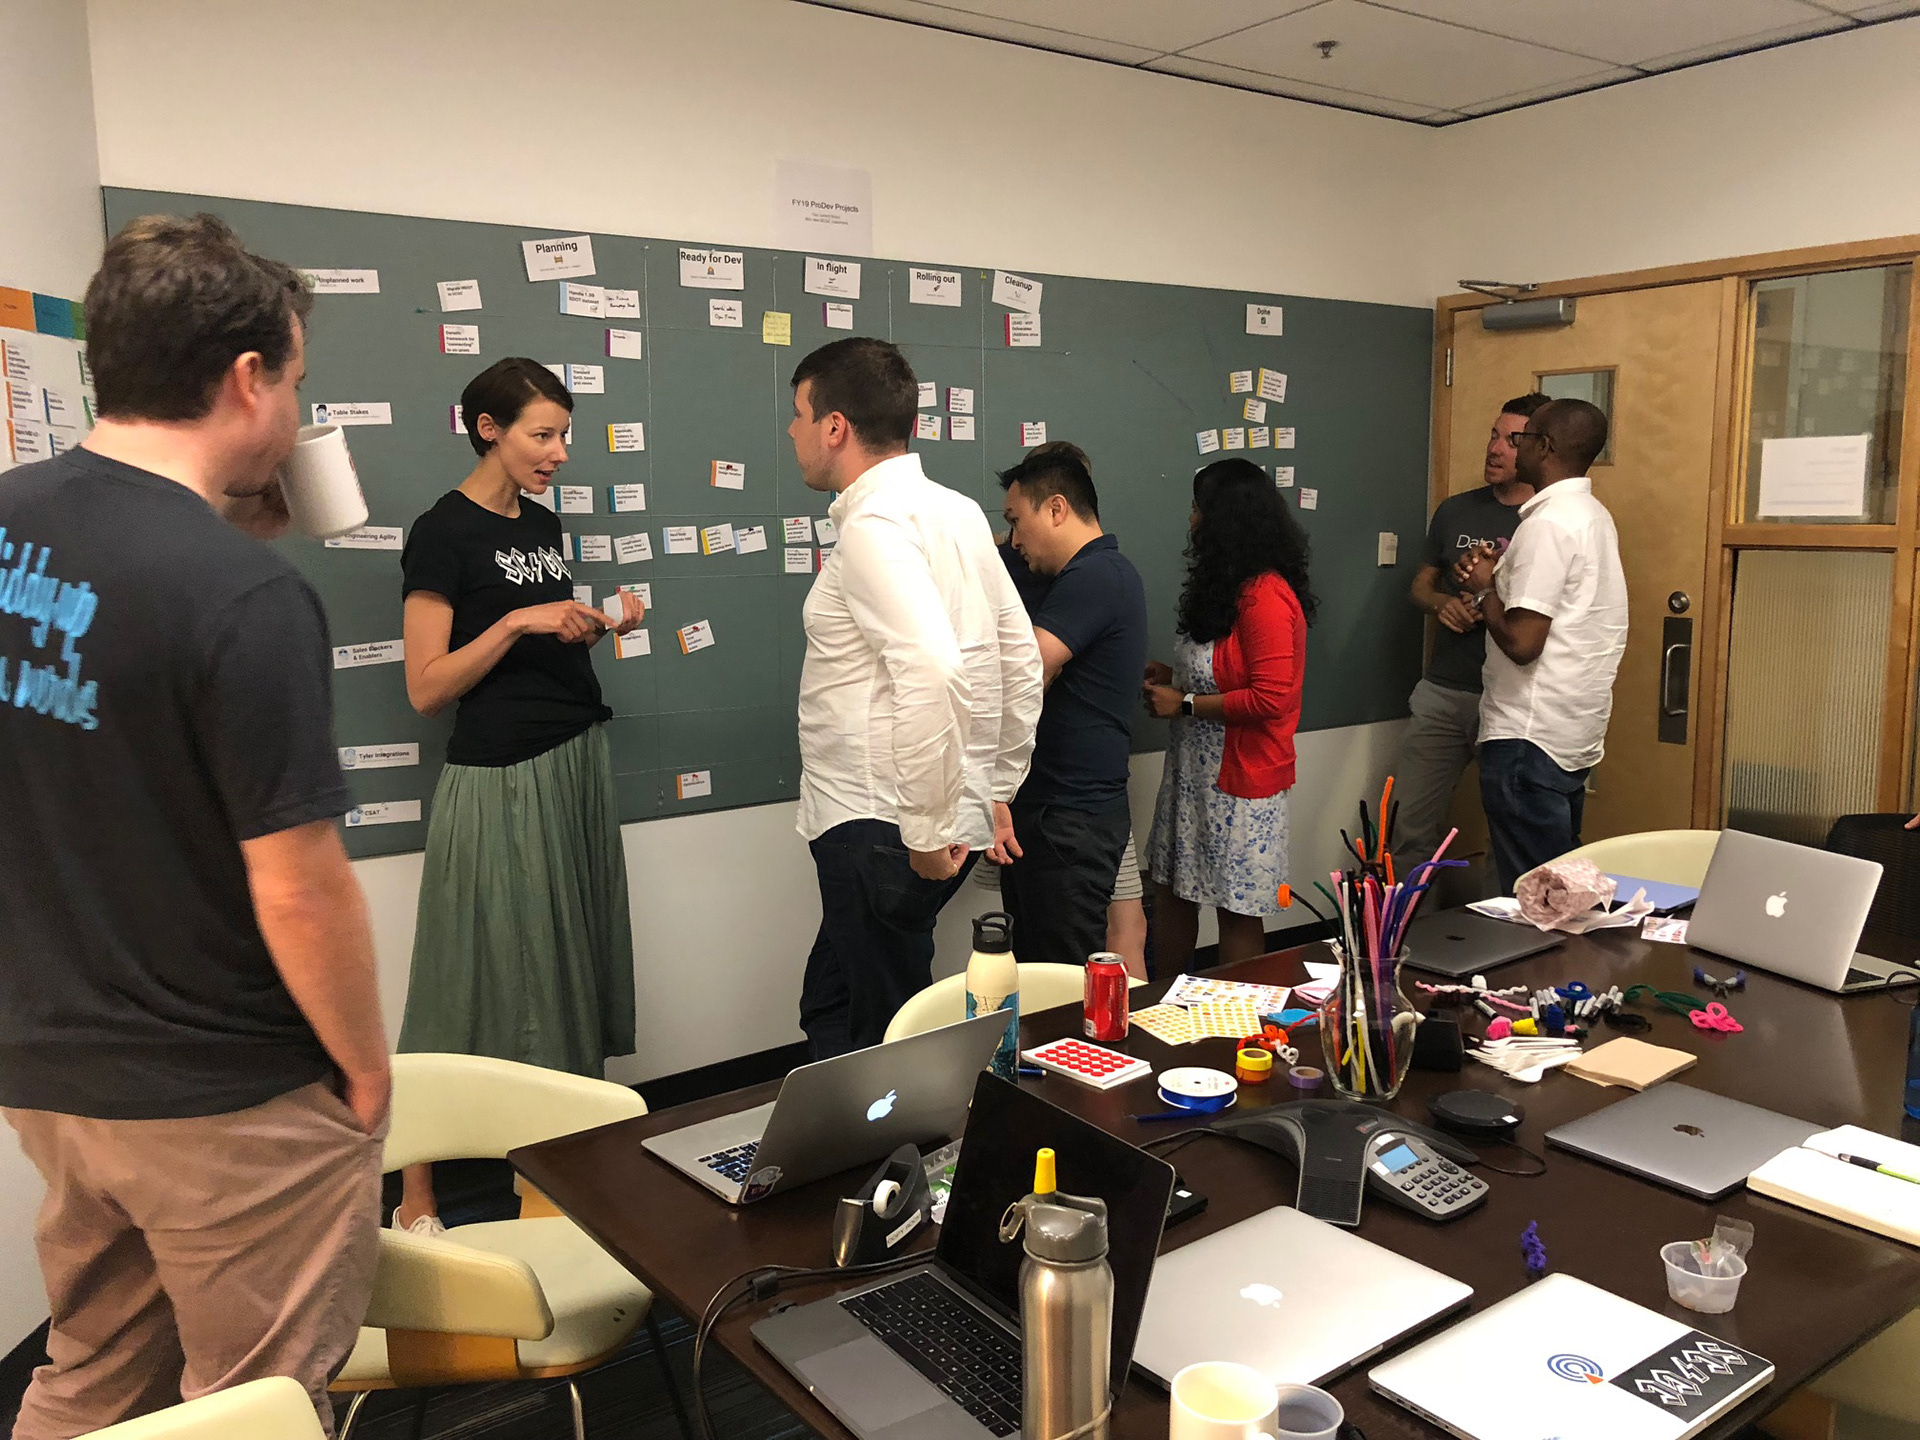
As we decomposed the plan into teams, we created a high-level board to track the general progress of an SCGC MVP and allow real-time iteration in person on the commitment. Each team could more granualrly work out (as a triad of design, PM, and engineering) where to cut the MVP from future business increments. THe temporary board helped identify team dependencies and shift projects without getting lost in a digital JIRA board. While maintaining the physical and digital boards was a lot of extra labor, it kept everyone up to speed as to where the project was and the office became a meeting cycle, where we could "walk the walls" to see how the MVP plan was evolving
MVP Workflows
Flow 1: Getting Data in (Dataset Management Experience.. DMX)
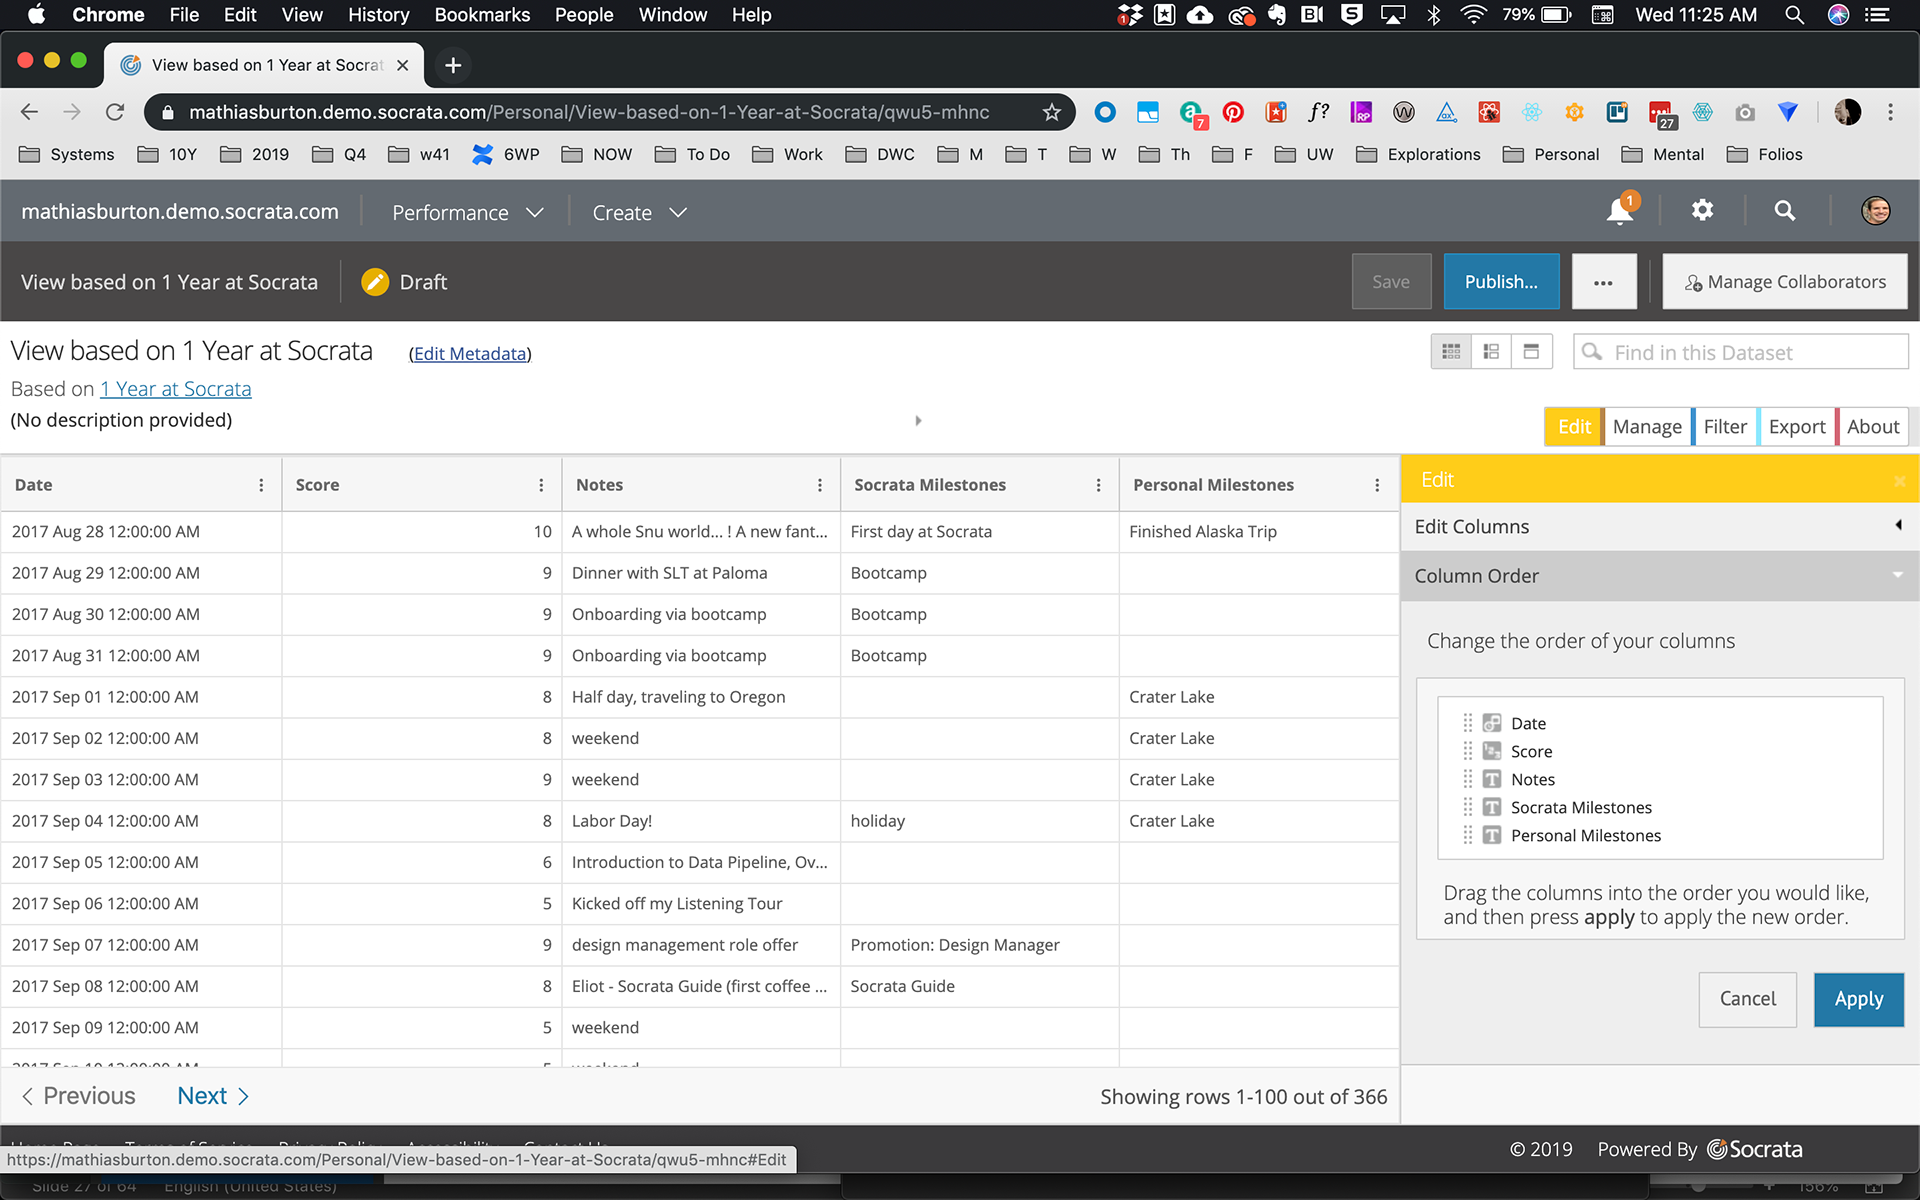
Flow 2: Explore Data (New "Grid View"
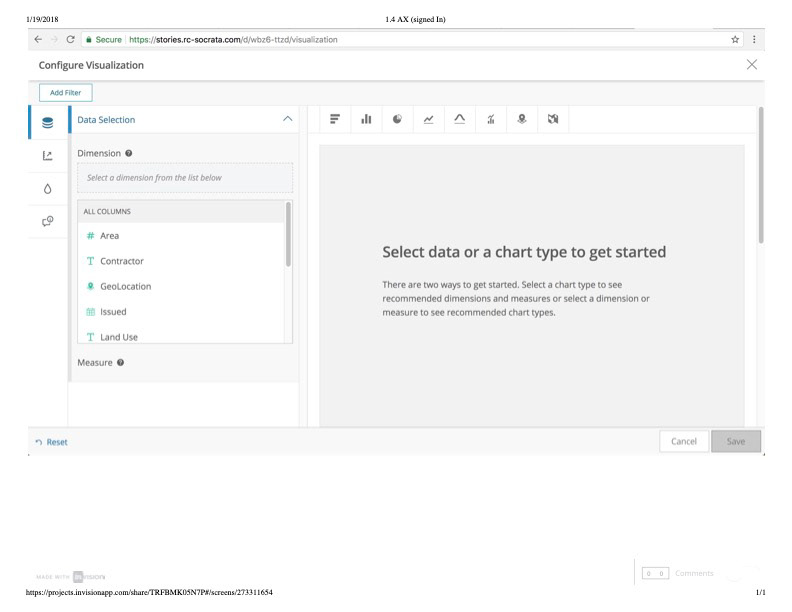
Flow 3: Visualize Insights (authoring Canvas)
Flow 4: Adding Context (Integration of our Perspective Product)